
Patchwork Insights has been really impactful at King’s. The data and insights unlocked through the extensive range of dashboards has helped us improve decision making and challenge where appropriate to further drive agency spend down. Patchwork Insights was a key determination in our procurement of Patchwork and it’s great to see those benefits coming through
Rob Chidlow
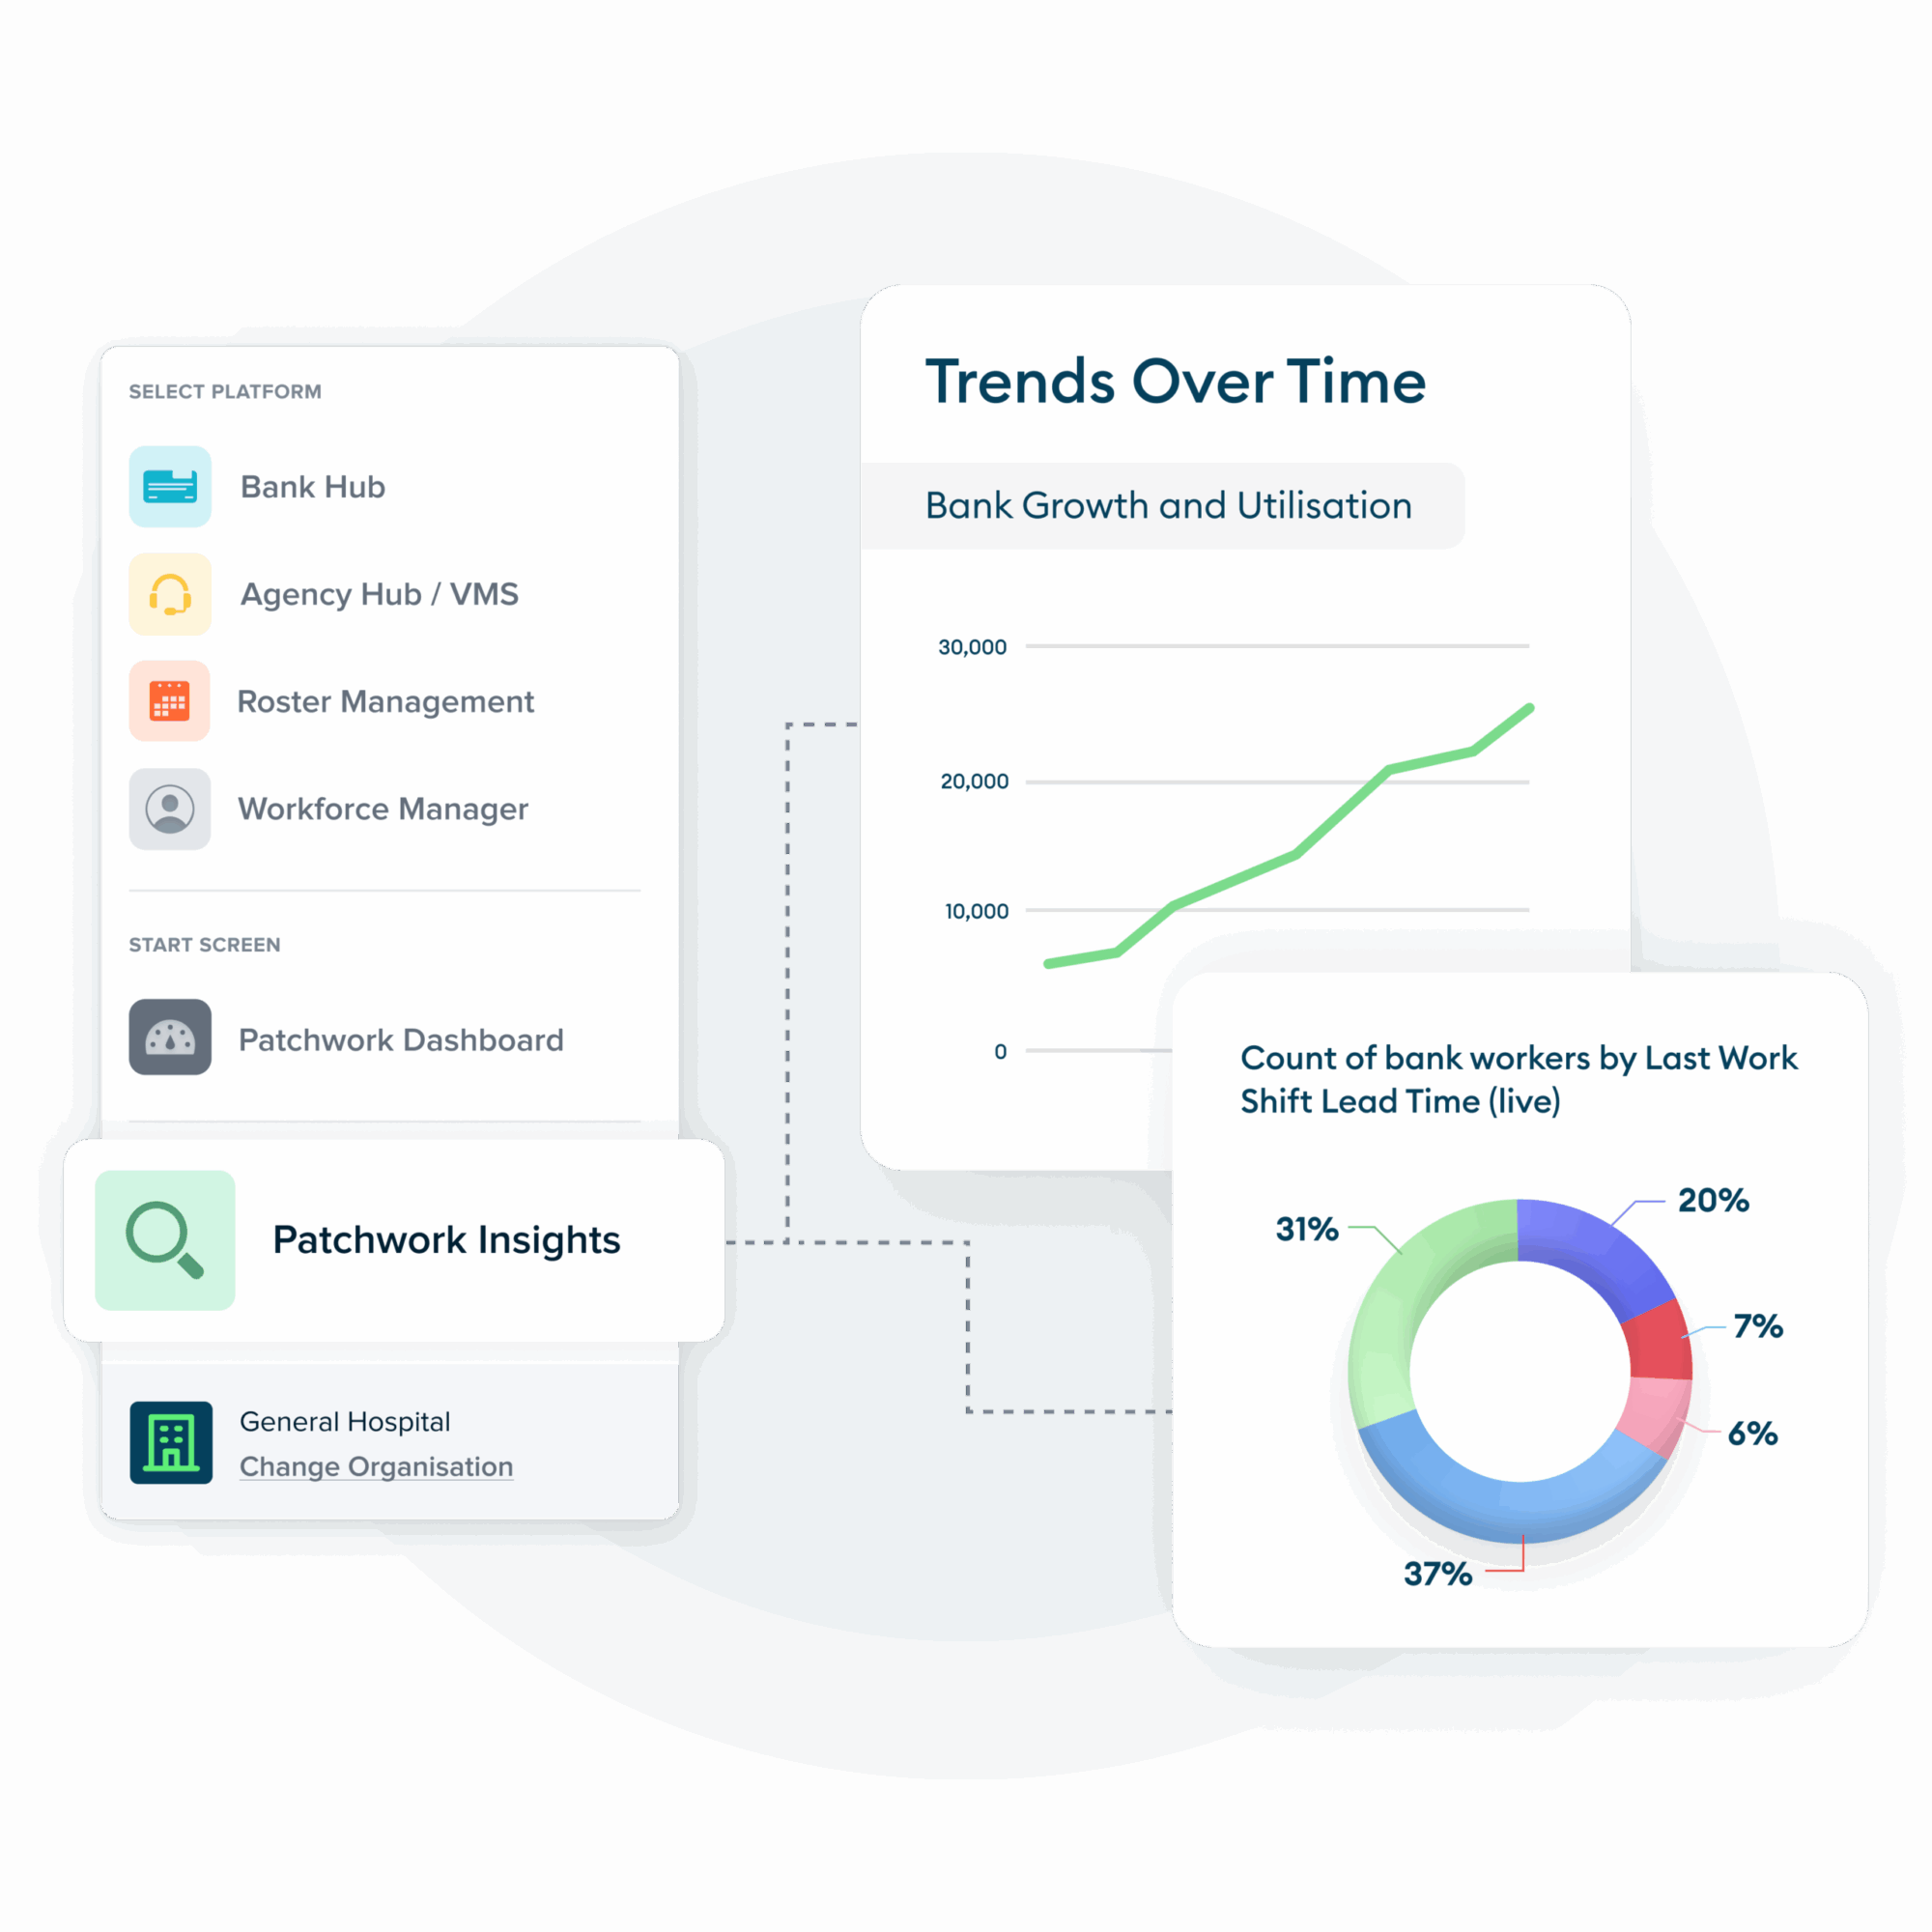
Site Director of FinanceFinally access the data you need to drive improvements in one place
Decisions are easier when they’re supported by data that everyone can see and actually use on a regular basis. Unlike other providers, we realise that data and reporting platforms must be intuitive.
That’s why we’ve built a system that replicates Excel where you need it, but with additional features to help you to interpret and act on the meaning behind the numbers.
With more staff engaging with your data, you get more transparency, more accountability and better outcomes.

Effectively communicate your full staffing picture
We’ve moved past manually aggregating figures from spreadsheets, so you can focus on taking action.
Patchwork Insights’ configurable dashboards provide 360 visibility of your workforce activities and costs. You can dig into the details of your staffing activities and spend at a local or regional level in one place, on demand (no add-on modules here).
We keep everything in system, so you never miss a report or lose sight of the data you need to drive improvements.


Monitor historical, current and future spending
With a detailed analysis of your financial performance, now you can easily identify areas of high spending, address the causes and reduce costs.

Better visibility of where your focus is most needed to regain financial control
One single source of truth enables more agile decision-making which drives growth and efficiency.
Our full suite of tailored, up-to-date dashboards means you never have to wonder where to focus your efforts to drive improvements. Understand the data behind higher and lower areas of activity and use that knowledge to boost cost efficiency and increase shift fill rates.

Report with ease and speed
Generate essential reports instantly and tailor data views with customisable templates. Share your findings effortlessly with key bodies like NHSEI, and securely access ICS-wide data – ensuring you’re always fully informed.


“The data coming from Patchwork Insights is set to change how we review our medical locum expenditure. Previously, we processed raw data through spreadsheets. Now, these visually appealing dashboards are the means by which each senior manager discusses their locum expenditure.”
Max Eldin-Taylor
Head of Business Support, Medicine and Integrated CareMore transparency, more accountability
Within customisable guardrails, your teams can have an equal opportunity to understand your performance metrics with Patchwork Insights. You can start fostering real responsibility and openness at all levels.
Consolidating data into one accessible platform gives workforce teams data on demand to take ownership of their decisions, encouraging innovation and boosting productivity.

Track the impact of your decisions
Measuring the success of any initiative in granular detail can be a challenge. Our data-rich reporting suite is a single source of truth so you can stay on top of escalated rates, agency tiers, annual leave and more via a 360 view of your service.

On-hand support
Choosing Patchwork Insights isn’t just about adopting an industry-leading data analytics tool. It’s about access to data-driven experts who can empower your teams to dive deep into challenges and maximise usage. Whatever your requirements, we’ll help you meet them.

Get the full data picture at your fingertips
With a blend of intuitive dashboards and simple filters, Patchwork Insights is a tool you’ll enjoy using. Whether you’re managing on-call schedules, streamlining staff onboarding, or analysing workforce trends, the crucial information you need is readily available around the clock.

“I have been hugely impressed with Patchwork Insights. The dashboards that have been created are up-to-date and easy to use, providing me and the workforce teams across North West London with all the key data we need to track and understand our performance and outcomes.”
Programme Lead Medical Workforce Deployment Systems
Flex your pool of workers
Our platform can support you to systematically analyse and match the demand for care with the supply of staff.
Access safe staffing analysis to identify hotspots for intervention within your region. With Patchwork Insights, you can easily compare % achievement for minimum and ideal staffing numbers across services in the region, helping you identify trends in demand and pressure.
Start a joined-up recruitment strategy across the region and discussion around the appropriate redeployment of staff.

Harmonise with local control
Enhanced data visibility improves regional pay rate harmonisation and streamlines reporting. Our dynamic data reporting blends live, detailed performance data across an ICS, while maintaining local-level control where required.
With the right agreements in place, Patchwork Insights surfaces comparative information about rates and shift activities across your region. Reduce organisational competition and promote a collaborative approach to pay rates.
